Oklahoma City Thunder vs Timberwolves Match Player Stats
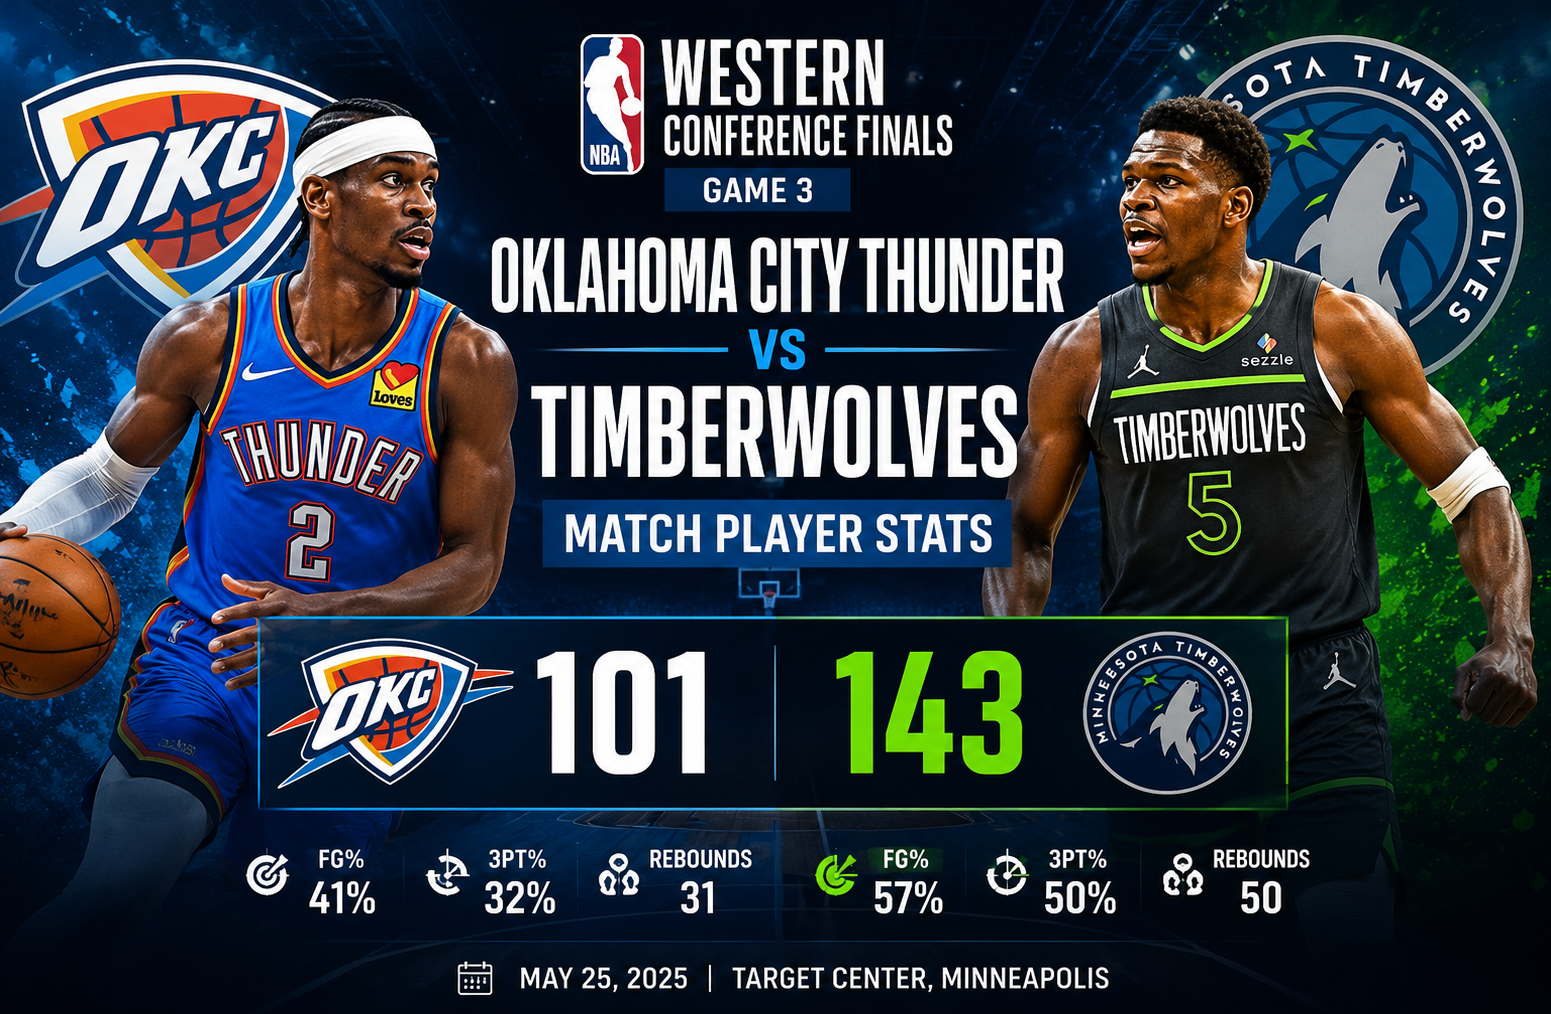
The Oklahoma city thunder vs Timberwolves match player stats from Game 3 of the 2025 NBA Western Conference Finals reveal one of the most dominant playoff performances of the season. Minnesota Timberwolves responded after dropping the first two games of the series by delivering a commanding 143 to 101 victory over the Oklahoma City Thunder at Target Center on May 25, 2025. While the final score immediately grabs attention, the numbers behind the game explain how Minnesota completely controlled every phase of play. From elite shooting efficiency and superior rebounding to balanced scoring and defensive pressure, every major statistic favored the Timberwolves.
This matchup also demonstrated how quickly momentum can shift during a playoff series. Oklahoma City entered the contest with the NBA’s best regular season record at 68 wins and 14 losses and held a 2 to 0 series advantage. However, Minnesota protected its home court with an explosive offensive display led by Anthony Edwards and supported by outstanding contributions across the roster. Examining the player statistics alongside the team numbers provides a much clearer understanding of why the game became so one sided and what lessons both teams carried into the remaining games of the Western Conference Finals.
Match Overview
| Match Detail | Information |
| Event | NBA Western Conference Finals Game 3 |
| Match | Oklahoma City Thunder vs Minnesota Timberwolves |
| Date | May 25, 2025 |
| Venue | Target Center, Minneapolis |
| Attendance | 19,112 |
| Broadcast | ABC |
| Final Score | Minnesota Timberwolves 143, Oklahoma City Thunder 101 |
| Series Before Game | Oklahoma City led 2 to 0 |
| Source | ESPN NBA |
Oklahoma City Thunder vs Timberwolves Match Player Stats Breakdown
Statistics often tell the real story of a basketball game, and this contest is an excellent example. Minnesota outperformed Oklahoma City in nearly every major category, leaving little opportunity for the Thunder to recover after a difficult opening quarter.
Team Statistics Comparison
| Category | Oklahoma City Thunder | Minnesota Timberwolves |
| Points | 101 | 143 |
| Field Goals | 35 of 86 (41%) | 55 of 96 (57%) |
| Three Pointers | 14 of 44 (32%) | 20 of 40 (50%) |
| Free Throws | 17 of 19 (89%) | 13 of 17 (76%) |
| Rebounds | 31 | 50 |
| Assists | 19 | 30 |
| Turnovers | 14 | 10 |
| Steals | 5 | 6 |
| Blocks | 3 | 3 |
Minnesota’s offensive efficiency stands out immediately. Shooting 57 percent from the field and 50 percent from beyond the arc is difficult to match in any playoff game. Oklahoma City, meanwhile, struggled to create quality looks and converted only 41 percent of its field goal attempts.
The rebounding difference also played a major role. Minnesota secured 19 more rebounds, creating extra possessions while limiting second chance opportunities for the Thunder.
Quarter by Quarter Analysis
First Quarter
| Team | Points |
| Oklahoma City | 14 |
| Minnesota | 34 |
Minnesota established control almost immediately. The Timberwolves played with tremendous pace while forcing Oklahoma City into difficult shots. A 20 point lead after the opening quarter completely changed the rhythm of the contest.
Second Quarter
| Team | Points |
| Oklahoma City | 27 |
| Minnesota | 38 |
Rather than slowing down, Minnesota continued attacking. Ball movement created open perimeter shots, and the Timberwolves consistently finished possessions with high percentage attempts.
Third Quarter
| Team | Points |
| Oklahoma City | 29 |
| Minnesota | 35 |
The Thunder showed greater offensive rhythm after halftime, but Minnesota answered every run. Their consistent scoring prevented Oklahoma City from reducing the deficit.
Fourth Quarter
| Team | Points |
| Oklahoma City | 31 |
| Minnesota | 36 |
With the outcome largely decided, both teams continued rotating players. Minnesota maintained its offensive intensity and comfortably finished with a 42 point victory.
Minnesota Timberwolves Player Statistics
Minnesota’s balanced attack was one of the biggest reasons behind the convincing win. Multiple players contributed offensively, making it difficult for Oklahoma City’s defense to focus on a single scorer.
Anthony Edwards
| Statistic | Value |
| Points | 30 |
| Rebounds | 9 |
| Assists | 6 |
Anthony Edwards once again proved why he is considered one of the league’s brightest young stars. His combination of athleticism, shot creation, and decision making placed constant pressure on Oklahoma City’s defense. Beyond his scoring, Edwards created opportunities for teammates and contributed significantly on the glass.
One of the most impressive aspects of his performance was his efficiency. Rather than forcing contested shots, Edwards consistently attacked favorable matchups and made smart passing decisions whenever double teams arrived.
Julius Randle
| Statistic | Value |
| Points | 24 |
| Rebounds | 4 |
| Assists | 3 |
Julius Randle provided valuable secondary scoring throughout the game. His physical style inside the paint complemented Minnesota’s perimeter attack and prevented Oklahoma City from focusing entirely on Anthony Edwards.
Terrence Shannon Jr.
| Statistic | Value |
| Points | 15 |
Terrence Shannon Jr. delivered one of the most impactful bench performances of the evening. His scoring helped maintain Minnesota’s momentum whenever the starters rested.
Jaden McDaniels
| Statistic | Value |
| Points | 10 |
| Rebounds | 6 |
| Assists | 4 |
McDaniels contributed across multiple statistical categories. His defensive versatility remained important while also providing efficient offensive production.
Rudy Gobert
| Statistic | Value |
| Points | 7 |
| Rebounds | 7 |
| Assists | 2 |
Gobert’s influence extended beyond the box score. His interior defense discouraged drives to the basket while his rebounding helped Minnesota dominate possession.
Mike Conley
| Statistic | Value |
| Points | 6 |
| Rebounds | 3 |
| Assists | 2 |
Although Conley did not post high scoring numbers, his leadership and decision making helped organize Minnesota’s offense throughout the contest.
Oklahoma City Thunder Player Statistics
The Thunder struggled collectively, and no player managed to establish consistent offensive rhythm. Minnesota’s defensive pressure disrupted Oklahoma City’s usual ball movement and limited transition opportunities.
Shai Gilgeous Alexander
| Statistic | Value |
| Points | 14 |
As Oklahoma City’s leading scorer, Shai Gilgeous Alexander was held well below his normal production. Minnesota consistently sent defensive help and forced difficult shot attempts, preventing him from taking over the game.
Jalen Williams
| Statistic | Value |
| Points | 13 |
Williams showed flashes of aggressive offense but was unable to sustain scoring for long stretches. The Timberwolves’ defensive rotations limited his driving lanes throughout the game.
Chet Holmgren
| Statistic | Value |
| Points | 10 |
Holmgren found scoring opportunities around the basket but faced a difficult challenge against Minnesota’s size and physical interior defense. The rebounding battle also limited his overall impact.
Why Minnesota Dominated the Game
Several statistical trends explain why the Timberwolves earned such a convincing victory.
Superior Shooting Efficiency
Minnesota converted more than half of its field goal attempts while also shooting an outstanding 50 percent from three point range. Efficient offense reduced empty possessions and allowed the Timberwolves to build an early lead.
Winning the Rebounding Battle
Collecting 50 rebounds compared to Oklahoma City’s 31 gave Minnesota additional scoring opportunities while preventing second chance baskets at the other end.
Balanced Offensive Production
Instead of relying solely on Anthony Edwards, Minnesota received meaningful scoring from Julius Randle, Terrence Shannon Jr., Jaden McDaniels, Rudy Gobert, and several supporting players. This balance made defensive adjustments extremely difficult.
Better Ball Movement
Thirty assists reflected excellent teamwork and unselfish basketball. Minnesota consistently generated open shots through quick passing and smart player movement.
Defensive Pressure
Holding the Thunder to just 101 points highlighted Minnesota’s defensive commitment. Oklahoma City never found sustained offensive rhythm after the opening minutes.
Advanced Statistical Analysis
Looking beyond the final score, the numbers reveal why Minnesota’s victory was far more than a hot shooting night. The Timberwolves controlled efficiency, possessions, spacing, and transition opportunities from the opening tip. These are often the statistics that decide playoff basketball, and Minnesota won nearly every one of them.
Shooting Efficiency Made the Difference
The largest gap between the two teams came in shooting accuracy.
| Category | Oklahoma City | Minnesota |
| Field Goal Percentage | 41% | 57% |
| Three Point Percentage | 32% | 50% |
| Free Throw Percentage | 89% | 76% |
Although Oklahoma City actually shot better from the free throw line, they attempted only 19 free throws and struggled everywhere else. Minnesota’s outstanding field goal percentage meant they rarely needed extra trips to the foul line.
Making 55 field goals on 96 attempts reflects excellent offensive execution rather than simply making difficult shots. Minnesota consistently generated open looks through effective passing and player movement.
Ball Movement Created Better Opportunities
One statistic that deserves special attention is assists.
Minnesota finished with 30 assists compared to Oklahoma City’s 19.
That difference shows how each offense operated throughout the night.
Minnesota consistently moved the basketball until the highest percentage shot became available. Instead of relying on isolation scoring, the Timberwolves created open perimeter shooters and easy finishes near the basket.
Oklahoma City’s offense looked much different. The Thunder frequently settled for contested jump shots after Minnesota disrupted their offensive rhythm.
Rebounding Controlled Possession
Winning the rebounding battle by 50 to 31 gave Minnesota a significant advantage.
Those extra rebounds accomplished several important objectives.
- Limited Oklahoma City’s second chance opportunities.
- Created additional offensive possessions.
- Allowed Minnesota to push the pace after defensive rebounds.
- Reduced transition opportunities for the Thunder.
Playoff games often become physical contests in the paint, and Minnesota clearly won that battle.
Individual Performance Analysis
Anthony Edwards Delivered a Superstar Performance
Every championship contender needs its best player to respond in pressure moments, and Anthony Edwards did exactly that.
His final numbers included:
- 30 points
- 9 rebounds
- 6 assists
What made his performance especially impressive was its balance.
He scored efficiently without forcing difficult shots, contributed on the glass, and consistently created scoring chances for teammates.
Rather than chasing statistics, Edwards played within Minnesota’s offensive system, making the correct decision nearly every possession.
Julius Randle Provided the Perfect Complement
While Edwards attracted most of Oklahoma City’s defensive attention, Julius Randle punished mismatches throughout the game.
His 24 points prevented the Thunder from sending multiple defenders toward Edwards every possession.
Randle’s physical presence inside also opened perimeter opportunities for Minnesota’s shooters.
Minnesota’s Supporting Cast Changed the Game
Championship teams rarely depend on one or two players.
Game 3 demonstrated exactly why roster depth matters.
Terrence Shannon Jr., Jaden McDaniels, Rudy Gobert, and Mike Conley each contributed in different ways.
Some added scoring.
Others controlled rebounds.
Others organized the offense.
Collectively, they created one of Minnesota’s most complete playoff performances of the season.
Oklahoma City’s Biggest Challenges
The Thunder entered Game 3 with tremendous confidence after winning the first two games of the series.
However, several problems quickly became apparent.
Offensive Rhythm Never Developed
Oklahoma City scored only 14 points during the opening quarter.
Falling behind by 20 points almost immediately forced the Thunder to play from behind for the remainder of the night.
Instead of executing their usual offense, they frequently rushed possessions in an attempt to erase the deficit.
Limited Production From Star Players
Shai Gilgeous Alexander finished with just 14 points.
Jalen Williams added 13.
Chet Holmgren scored 10.
When the team’s three primary offensive players combine for only 37 points, winning becomes extremely difficult against an opponent shooting as efficiently as Minnesota.
Defensive Breakdowns
Allowing 143 points during the Western Conference Finals highlights defensive issues across multiple areas.
Minnesota repeatedly found open shooters.
Transition defense struggled.
Interior rotations arrived late.
Closeouts on perimeter shooters lacked urgency.
These breakdowns allowed the Timberwolves to build confidence throughout the evening.
How Game 3 Changed the Series
Although Minnesota earned an impressive victory, the series remained in Oklahoma City’s favor.
The Western Conference Finals progressed as follows.
| Game | Result |
| Game 1 | Oklahoma City 114, Minnesota 88 |
| Game 2 | Oklahoma City 118, Minnesota 103 |
| Game 3 | Minnesota 143, Oklahoma City 101 |
| Game 4 | Oklahoma City 128, Minnesota 126 |
| Game 5 | Oklahoma City 124, Minnesota 94 |
Game 3 proved Minnesota could compete with Oklahoma City when executing its game plan effectively.
However, Oklahoma City’s response over the following two games demonstrated why they finished with the NBA’s best regular season record.
The Thunder adjusted defensively, regained offensive balance, and ultimately secured the series.
Biggest Takeaways From the Match
Several lessons emerged from this contest.
Early Momentum Matters
Minnesota’s 34 point opening quarter immediately placed Oklahoma City under pressure.
Starting fast in playoff basketball often changes both strategy and confidence.
Efficient Shooting Wins Playoff Games
The Timberwolves shot 57 percent from the field and 50 percent from beyond the arc.
Those numbers are difficult for any opponent to overcome.
Team Basketball Beats Isolation
Thirty assists reflected outstanding offensive chemistry.
Minnesota consistently trusted the extra pass instead of forcing contested shots.
Rebounding Cannot Be Overlooked
A plus 19 rebounding advantage helped Minnesota dominate possession throughout the game.
That advantage translated directly into scoring opportunities.
What Fans Can Learn From These Statistics
When analyzing NBA games, fans often focus only on total points.
This matchup demonstrates why several other statistics deserve equal attention.
Pay close attention to:
- Field goal percentage
- Three point efficiency
- Assists
- Total rebounds
- Turnovers
- First quarter scoring
Together, these categories usually explain why one team controlled the game.
The oklahoma city thunder vs timberwolves match player stats are a perfect example. The final score was simply the result of Minnesota winning nearly every important statistical battle.
Frequently Asked Questions
Who was the leading scorer in Oklahoma City Thunder vs Minnesota Timberwolves Game 3?
Anthony Edwards led all scorers with 30 points while also contributing 9 rebounds and 6 assists.
What was the final score of the game?
Minnesota Timberwolves defeated Oklahoma City Thunder 143 to 101 in Game 3 of the 2025 Western Conference Finals.
Who scored the most points for Oklahoma City?
Shai Gilgeous Alexander led the Thunder with 14 points.
Why did Minnesota win by such a large margin?
Minnesota combined elite shooting, dominant rebounding, balanced scoring, and excellent ball movement while limiting Oklahoma City’s offensive efficiency.
How many rebounds did Minnesota collect?
The Timberwolves finished with 50 rebounds compared to Oklahoma City’s 31.
Where was the game played?
The game took place at Target Center in Minneapolis, Minnesota, on May 25, 2025.
Conclusion
The oklahoma city thunder vs timberwolves match player stats highlight one of the most convincing victories of the 2025 NBA playoffs. Minnesota responded to an early series deficit with outstanding teamwork, remarkable shooting efficiency, and disciplined execution on both ends of the floor. Anthony Edwards led the way with an outstanding all around performance, while Julius Randle and the supporting cast ensured the offense never slowed down.
For Oklahoma City, the statistics serve as an example of how quickly momentum can change during postseason basketball. The Thunder struggled offensively, lost the rebounding battle, and were unable to slow Minnesota’s balanced attack. Although Oklahoma City later recovered to win the series, Game 3 remains an excellent case study in how efficient shooting, strong rebounding, and unselfish basketball can completely change the outcome of a playoff game. Fans reviewing the oklahoma city thunder vs timberwolves match player stats will find that every major statistical category supports the story told by the final score.